Demand forecasting for FMCG distribution.
Forecast primary sales for every distributor, area and depot. See the festival months move, and see how close each forecast came.
The app, in your trade's words.
This demo carries 1,150 distributors and 55 months of invented history.
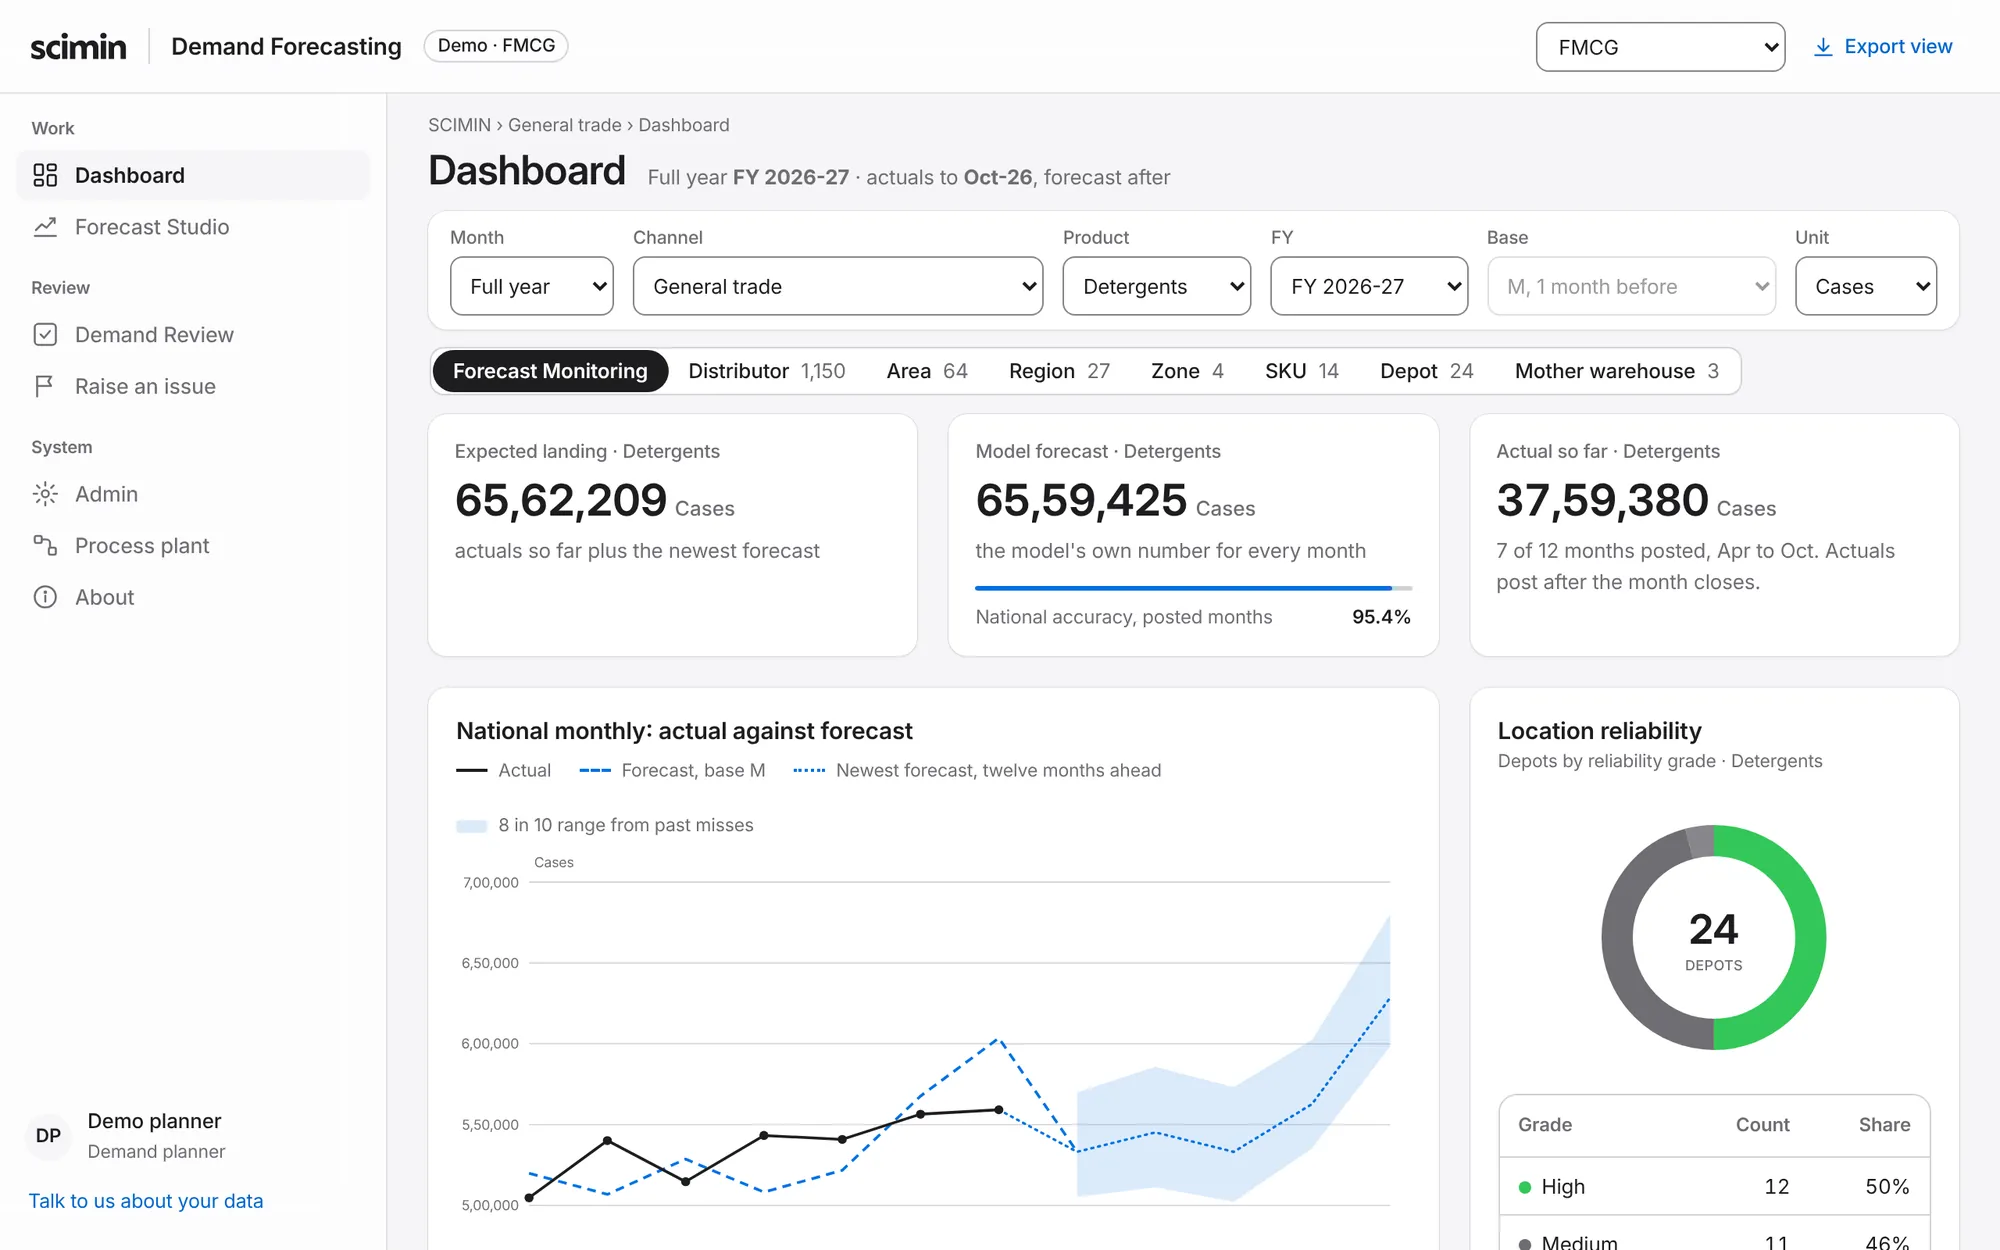
What the pack sets.
- Who plans
- Demand planner
- Channel
- General trade, Modern trade, E-commerce and quick commerce
- Sales tree
- Zone, Region, Area and Distributor or Key account or Platform DC
- Supply tree
- Mother warehouse and Depot
- Catalogue
- SKUs in six families, such as Detergents, Bath soaps, Tea
- Units
- Cases and MT
- Calendar
- A festival window that moves with Diwali.
- Review steps
- Area sales manager, then Regional sales manager, then Demand planner
- Output
- Monthly demand plan workbook
What is hard here.
- Primary sales are what you ship, not what the market bought. Month-end loading and schemes sit inside the number.
- Sales areas and depots do not nest. A depot serves several areas, and an area draws from several depots.
- Diwali moves between October and November. A model with fixed months puts the peak in the wrong place.
Try this in the demo.
- Open Edible oils and compare October with November.
- Open a zone, then a region, down to one distributor.
- Switch the unit from cases to tonnes.
- Open the Demand Review and change one area's number.